If you’ve ever managed a complex project, you may have wondered, what is a Gantt chart, and how can it help streamline workflows? Their timelines is one of the most effective tools for organizing tasks, tracking progress, and achieving goals. In this guide, we’ll define what is a Gantt chart, explain how to create one, and share examples to make your projects more efficient.
Define Gantt Chart
Using the Gantt chart in production
No matter which stage of production you’re in, staying organized isn’t really a suggestion. If you’re in the field, you know how vital it is to not only getting everything done, but keeping your sanity. Let’s go over one tool to help you to do that.
GANTT CHART DEFINITION
What is a Gantt Chart?
So, what is a Gantt chart? It's a project management tool that visualizes tasks along a timeline. Each task is represented as a horizontal bar, with its length corresponding to the duration of the task.
Simply put, it's a bar chart where each bar marks the start and end of each task or activity. It is often used as a project calendar or production calendar in film and tv production. It is the ultimate project management tool. In film or TV production, you can have each bar represent each stage of production, for example – development, pre-production, production, post-production, and distribution.
By laying everything out, you can also determine if there are any dependencies. A dependency is a task that needs to be completed before the next one can get done. In other words, one task is dependent on another. For example, you can’t start rehearsals or table reads, without a cast. So casting on your chart would be considered a dependency.
Why are Gantt charts powerful?
- Clearly visualize tasks and their durations.
- Organize key phases, like pre-production, with ease.
- Identify and manage task dependencies effectively.
Gantt Chart for Project Management
History of the Gantt Chart
Originally, invented by Polish engineer, Karol Adamiecki in 1896. He came up with the idea of displaying processes visually.
But because everything was written in Polish, it never caught on with English-speakers.
In 1920, Henry Gantt had the same idea. He started planning bar charts to help supervisors in the steel industry track production schedules. His name is now attached to this visual planning methodology, but it was really Adamiecki, who first brought it to fruition.
The basic, albeit, obsolete model, looks something like this:

Antiquated example
And over time, they have developed some. But even these newer charts feel a bit obsolete and over complicated.
By now, you may be asking again, “What is a Gantt chart’s primary function?” It’s to provide a clear and concise visual roadmap for projects of any size.
Gantt Charts Examples
What Does a Gantt Chart Look Like?
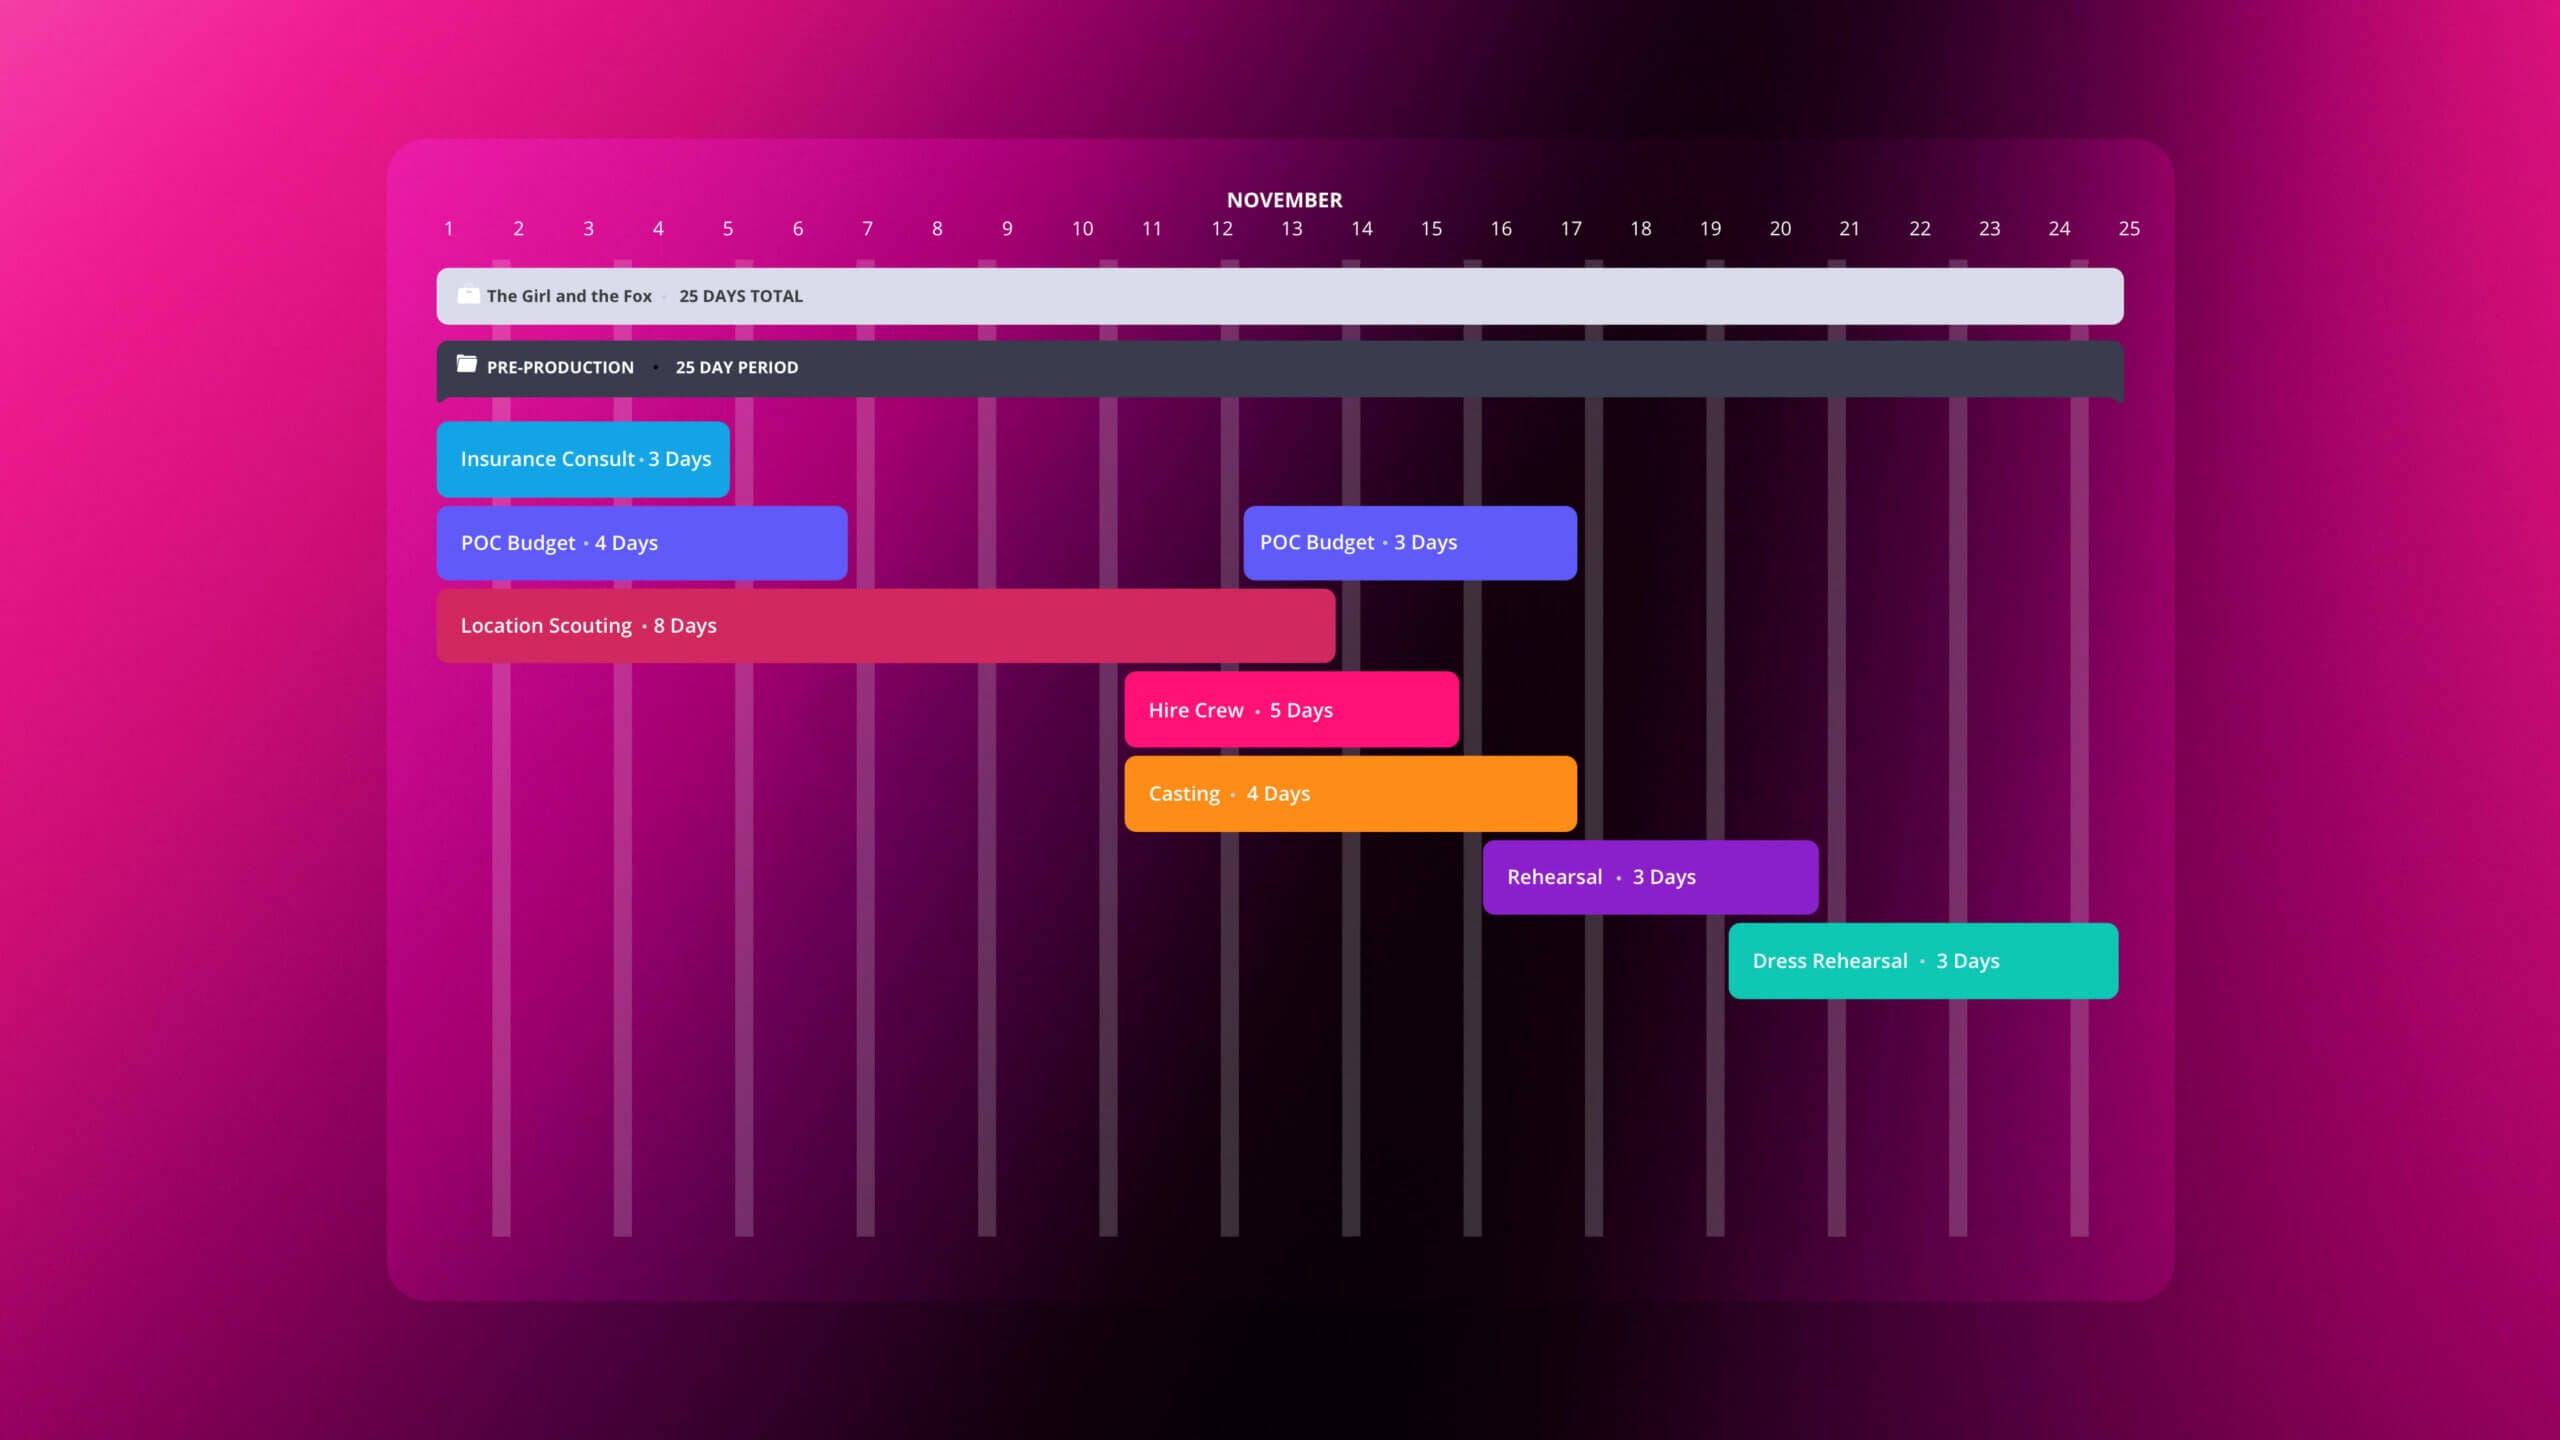
Curious about how Gantt charts can simplify your projects? These visual tools bring clarity and structure to timelines, tasks, and milestones—perfect for filmmakers, marketers, and event planners alike. Whether you're launching a campaign, managing a production, or planning an event, a well-crafted chart can transform chaos into smooth workflows.
A Gantt chart typically includes:
- Timeline: A horizontal axis showing project duration.
- Tasks: Horizontal bars representing activities.
- Milestones: Markers for critical goals like “Launch Campaign.”
- Dependencies: Arrows linking interrelated tasks.
Still curious? Explore Filmmaking Workflow Tips for expert advice on optimizing your production processes. Let’s take a look at a few use cases.
You can get as specific or general with your calendar as you’d like. See how it works below.
Streamlined production calendars
Gantt Chart Use Cases
1. Film Production
Directors use Gantt charts to schedule casting, location scouting, and editing. A free Gantt chart template simplifies pre-production planning. Access our Filmmaking Templates and Resources to streamline your production workflow.
2. Marketing Campaigns
Marketers rely on Gantt chart free tools to manage ad launches, content creation, and analytics tracking. A well-organized timeline ensures deadlines are met.
3. Event Planning
Event planners use a Gantt chart for project management to coordinate logistics, promotions, and vendor schedules. For more complex timelines, check out our tips on Timeline Management for Large Productions.Getting Started
Master the Art of Gantt Charts
Ready to streamline your project planning? Learn how to create a Gantt chart that turns complex timelines into a clear, actionable roadmap. From defining your scope to customizing and updating in real-time, this guide will have you managing projects like a pro.
If you’re wondering how to create a Gantt chart, it generally follows this process:
Define Your Scope
Identify all tasks, deadlines, and milestones needed to complete your project.
Choose the Best Format
Select a template or software. The ideal format for planning depends on your project’s complexity and team size. If you’re not sure where to start, check out our step-by-step guide on How to Create a Production Schedule.
Input Tasks and Dependencies
Break down your project into individual tasks and organize them on a timeline. Clearly define the start and end dates for each task and align them with project milestones. Link dependencies between tasks to ensure a smooth workflow, such as “secure location before filming” or “finalize script before rehearsals.” This helps identify critical paths, avoid bottlenecks, and maintain a realistic timeline for project completion. Prioritize tasks with multiple dependencies and use visual cues, like arrows, to show how tasks interconnect for better team alignment.
Customize Your Chart
Tailor your Gantt chart to fit your project’s needs. Use color coding to distinguish tasks or phases, adjust durations for accuracy, and highlight key milestones like “Launch Campaign.” Add notes or labels to enhance clarity, ensuring your chart is both functional and visually engaging.
Update Regularly
Modern tools allow real-time updates, ensuring your timeline reflects current project status. For additional efficiency, pair this with Task Management Tools for Filmmakers to integrate task management seamlessly.
Take Control of Your Projects
With a well-crafted Gantt chart, you can transform even the most complex projects into streamlined successes. Follow these steps to plan, organize, and execute with confidence.
Related Posts
FAQs About Gantt Charts
What Is a Gantt Chart Used For?
A Gantt chart organizes tasks, dependencies, and milestones into a clear visual format, ensuring project success. It provides a timeline view of the entire project, making it easy to track progress, identify potential bottlenecks, and adjust schedules as needed.
What Is the Best Format for Gantt Charts?
The best format for Gantt chart planning depends on your needs. Tools like StudioBinder provide advanced digital features, while our guide on Best Practices for Creative Project Planning offers essential tips for success.
How Do You Create a Gantt Chart for Complex Projects?
Creating a chart starts with defining the project scope and breaking tasks into smaller, manageable components. Each task should have clear timelines, assigned resources, and dependencies mapped to prevent bottlenecks.
Using the right tool, like StudioBinder, makes the process easier. These tools offer templates and visual aids to simplify inputting details, linking dependencies, and organizing tasks efficiently.
Pro Tip
Keep the chart dynamic by updating it regularly to reflect changes. Sharing the chart with your team ensures everyone stays aligned and aware of the project's progress.
Gantt charts are more than just visual timelines—they’re powerful tools for managing complex projects. By organizing tasks, tracking progress, and mapping dependencies, they provide clarity and structure. But why should you rely this over other project management methods? Let’s explore…
Why Use Gantt Chart
Do Gantt Charts Really Help?
Teams use them for project management to track progress, manage dependencies, and align milestones. For example, a filmmaker can use a Gantt chart timeline to manage casting, filming, and editing. To streamline your own workflow, explore our list of the best project management software for filmmakers, where you’ll find the best platforms to boost productivity for your production.
Production management softwares like StudioBinder have these charts built in. We call it a production calendar, and it allows you to collaborate and share the chart with any and everyone.You can get as specific or general with your calendar as you’d like. See how it works below.
Example for project management
Fast Drag and Drop Interface
Productions change constantly. So it's pretty critical to have software or some kind of organizational tool that can keep up with your needs. StudioBinder allows you to click and drag to draw events. Or you can drag the ends of each bar to adjust the length of the event, task, or activity if necessary. Don't let the last minute changes stress you out. It is possible to stay in control of your workflow.
Assign Tasks, Attach Files and Notes
Forget all of the emailing back and forth. Assign your team to specific tasks and track their progress in real-time. You can also store files, documents, and any other notes all in one secure place.
Focus on What Matter with Precise Filtering
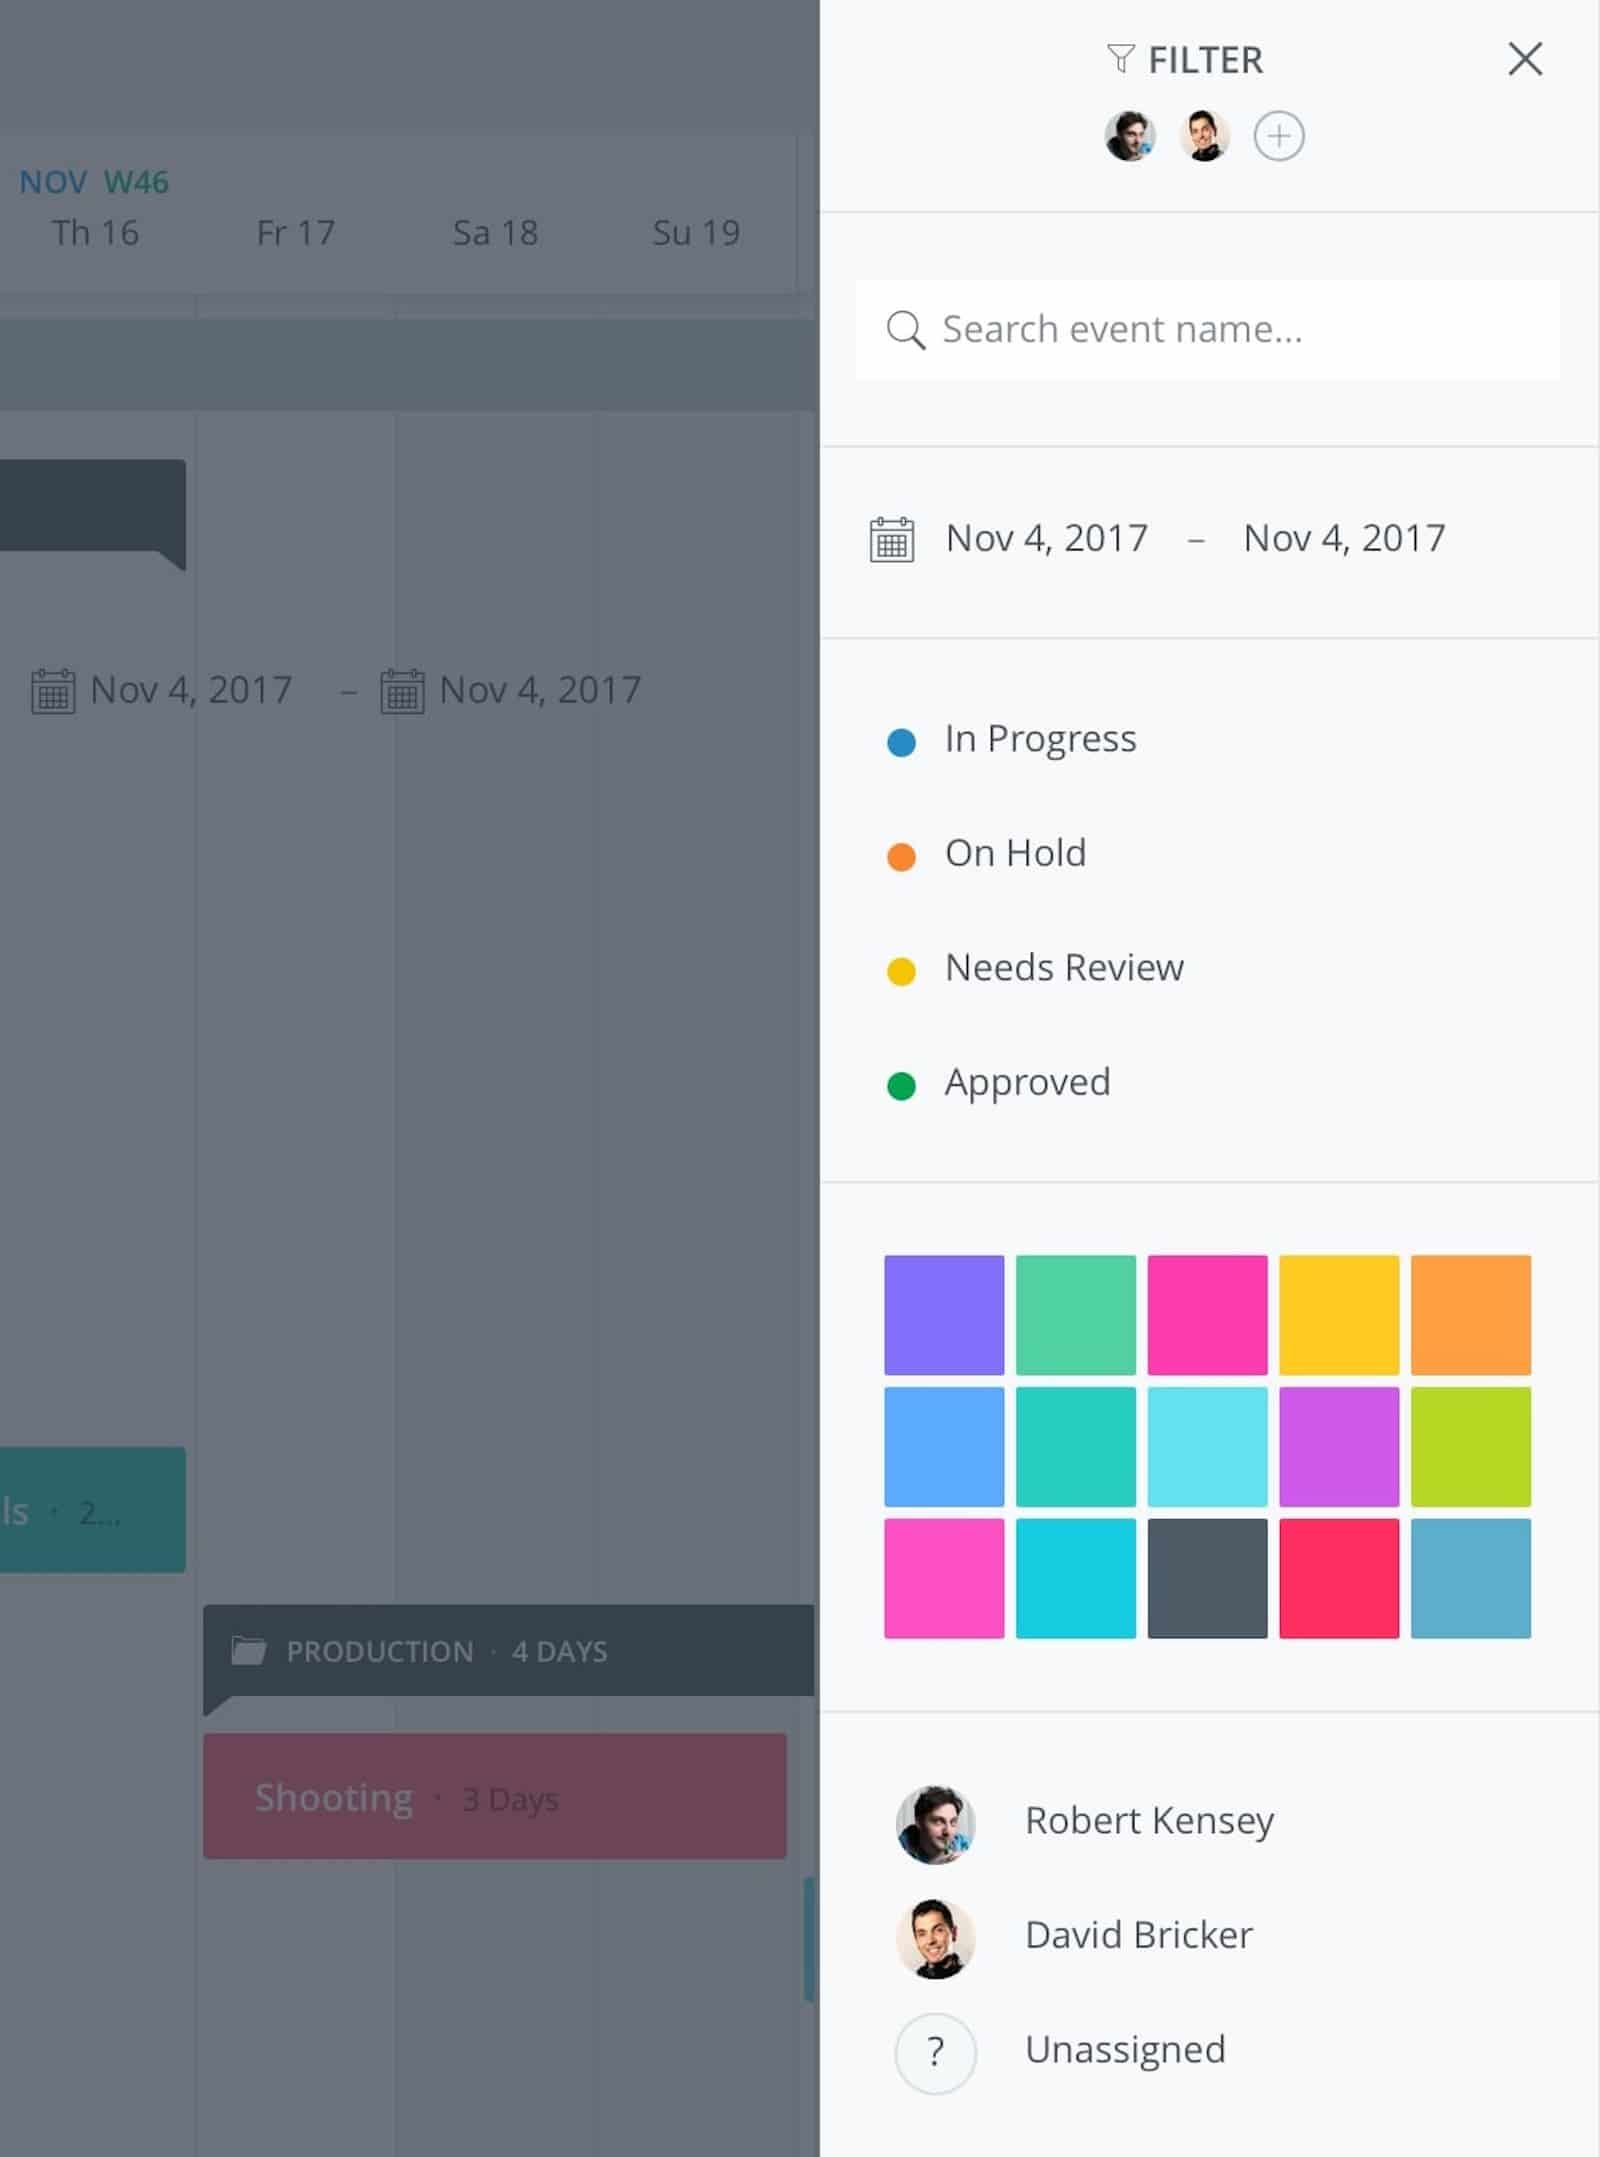
Filter by color, status, due dates, or crew members to narrow your focus on what needs to get done minute by minute.

Filter by color, status, and more
Save Custom Calendars
If you like a specific calendar you made, save it was a template, and re use it with new information. No need to reinvent the wheel for every new project.
Dependencies
Dependencies within StudioBinder’s production calendar enable you to connect events to one another and detect conflicts at a glance.
You can’t shoot anything without a location, and you can't rehearse without a cast. The software calls out conflicts so your production moves efficiently from one step to the next.
Manage Your Master Calendar
You can finally see the timelines of all of your productions on a single page. A master calendar to oversee multiples projects in one view.
At a glance, gain insight into how your resources are doing across all projects on monthly, quarterly, or yearly basis.
Now what?
How do I make a Gantt chart?
It's possible to attempt to make these in excel, but it wouldn't be as intuitive and you'd have to do some manual formatting. StudioBinder offers a free Gantt chart template. Though, if you're looking for more of the drag and drop interface that synchronizes with all of your other production data, using Gantt chart software, would be your best option.
Related Posts
Up Next
Free Online Gantt Chart
Now that you know what a Gantt chart is, it’s time to put it into practice. Download a free template or explore tools designed to simplify project workflows. If you’re managing a team, our guide on How to Collaborate with Your Team provides tips to enhance communication and efficiency. A Gantt chart for project management is your roadmap to success.

